
PixPlot
Overview
PixPlot facilitates the dynamic exploration of tens of thousands of images. Inspired by Benoît Seguin et al.’s paper at DH Krakow (2016), PixPlot uses the penultimate layer of a pre-trained convolutional neural network for image captioning to derive a robost featurization space in 2,048 dimensions.
Initial projects at Yale have used the software to visualize cultural heritage images held in the Beinecke Rare Book & Manuscript Library, Yale Center for British Art, and the Medical Historical Library.
Improved Dimensionality Reduction
In order to collapse those 2,048 dimensions into something that can be rendered on a computer screen, we turned to Uniform Manifold Approximation and Projection (UMAP), a dimensionality reduction technique similar to t-Distributed Stochastic Neighbor Embedding (t-SNE) that seeks to preserve both local clusters and an interpretable global shape.
Dynamic Visualization
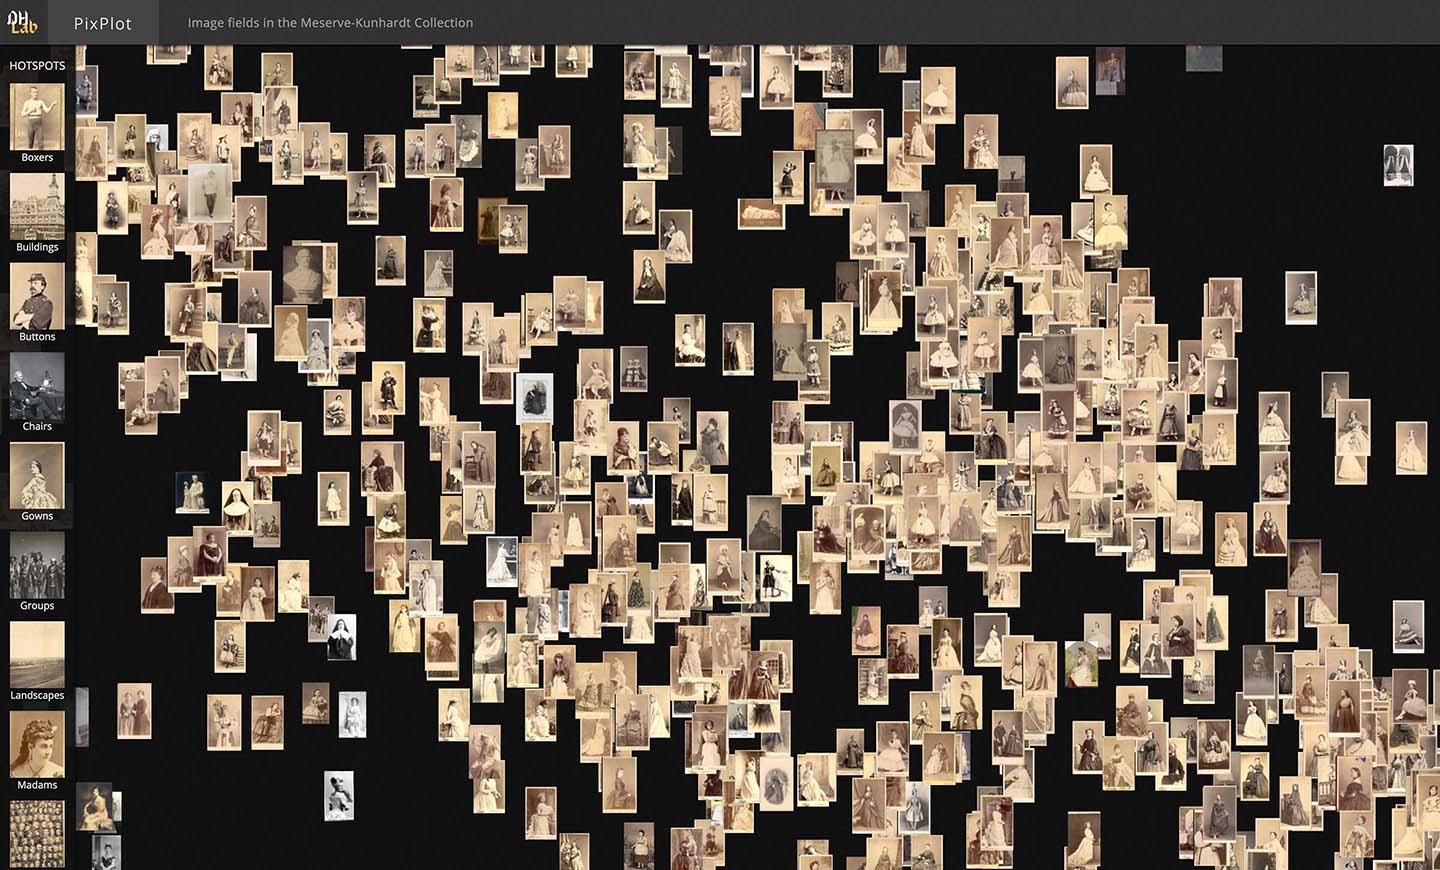
To visualize the results, we looked to approaches more commonly deployed in 3D game design. The resulting WebGL-powered visualization consists of a two-dimensional projection within which similar images cluster together. Users can navigate the space by panning and zooming in and out of clusters of interest, or they can jump to designated “hotspots” that feature a representative image from each cluster, as identified by the computer. There is also the possibility for users to curate their own hotspot clusters.

Software Updates
Since launching PixPlot in 2017, we have continued to implement new features that enhance the functionality and user experience of the software. These include adding:
- new layout options, such as:
- rasterfairy (a grid view that facilitates viewing similar images all at once),
- a date-based option that sorts images into temporal columns,
- animations between layout views,
- selecting and exporting tools,
- IIIF integration,
- single-vertex primitives to enable users to display lots of images.
Future Developments
We are currently working on additional enhancements to the software that include:
- layouts based on user-provided metadata (such as geography),
- basic search functionality,
- improved shader performance,
- enhanced sharing features,
- text annotations within plots.
For more on the underlying code, visit the DHLab’s GitHub repository. The code was authored by Yale Digital Humanities Lab Developer Douglas Duhaime.